Spring is in full swing, and we are excited to announce the first ArcGIS Business Analyst Pro release of 2025! ArcGIS Business Analyst Pro 3.5 brings new features and enhancements designed to elevate your market intelligence and decision-making processes.
ArcGIS Business Analyst Pro is an extension for ArcGIS Pro that allows you to perform sophisticated spatial analysis and modeling, including customer and competitor analysis, territory design, target marketing, and site selection.
The May 2025 release of ArcGIS Business Analyst Pro is packed with updates and enhancements to improve your workflows. Keep reading to explore the details.
- Updates to color-coded layers
- Improvements to benchmark comparisons workflow
- Updated suitability analysis workflow
- Updates to territory design
- Enhancements to the Results pane
- Data browser improvements
- Updates to working with segmentation data
Updates to color-coded layers
The color-coded layer workflow has become a favorite among Business Analyst Pro users for its ability to effectively visualize data. This workflow creates a group layer that displays the distribution of a selected variable on the map, with sublayers representing different geographic levels. In the latest release of Pro 3.5, we are excited to introduce new symbology types that will enhance your analysis. For the first time, users can now utilize bivariate colors, allowing for a more nuanced understanding of the relationship between two variables. Previously, the color-coded layers workflow was limited to analyzing a single variable at a time. With this update, you can now leverage bivariate colors or graduated colors to gain deeper insights into your data.

The workflow now displays geography levels as interactive lists, making it even easier to update the map and watch the level of detail change in real time.

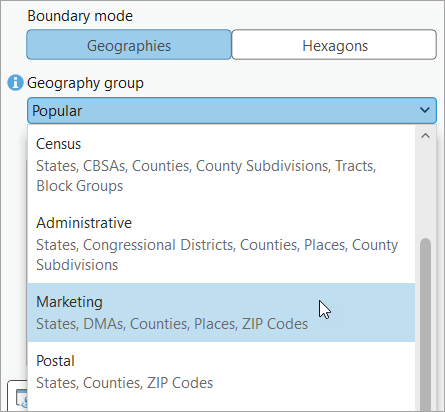
When using the Esri 2024 online data source, geography levels are now organized in groups by relative topic. For example, say you work as a marketing analyst and you want to look at levels related to marketing activities. Simply switch the geography group to Marketing to see filtered levels of detail related to that group.
Improvements to benchmark comparisons workflow
The benchmark comparisons workflow allows you to compare various locations, such as trade areas or standard geographies, using the variables and site attributes of your choice. With the release of Pro 3.5, adding neighboring geographies to your analysis has never been easier, thanks to the new site filtering feature. You can now utilize innovative comparison methods to analyze the distribution of datasets effectively. By comparing sites against one another, you can identify your next best location using the newly introduced benchmark methods, including Top and Bottom, High to Low, and Above and Below.

The Results pane has also been enhanced with thematically colored records to show data rankings and groupings in the table view that sync to a color-matched map layer.

Sharing your work? No problem! The export to Excel option has been enhanced to support exports of the new thematically colored cells.

Updated suitability analysis workflow
Suitability analysis is a powerful workflow that helps you rank and score locations based on multiple weighted criteria. In the last release of Business Analyst Pro in November 2024, we introduced a refresh to this workflow, and with the latest update, we’ve built upon those improvements to provide an even better user experience. Users can now set up and run the analysis seamlessly, without the need to open individual geoprocessing tools. When you add criteria or a target site, the tools will now appear in a separate free-floating pane, allowing for uninterrupted interaction with your criteria and settings. Additionally, when selecting data from the data browser to incorporate into your workflow, the Suitability Analysis pane automatically opens, ensuring easy viewing and facilitating a seamless analysis process.

You can also reorder criteria in the suitability analysis, offering more personalization. Simply drag and drop or right–click and select a command to reorder.

Filtering options have also been improved. Previously, when users filtered some of the suitability criteria in the workflow, candidate sites that did not meet the filtered criteria would not display on the map. With this release, the excluded sites remain visible with a clear outline even though they are not included in the analysis.

Made a mistake? We get it. Easily undo or redo criteria modifications in the workflow. Lastly, the Results pane has been improved in the workflow. The statistics card has been added in suitability analysis workflow, making it possible to view a comprehensive statistical overview in the Results pane’s summary view.

Updates to territory design
Territory design is a set of tools to build, edit, balance, and maintain territories using point and polygon datasets. In the latest update, the Modify Territories pane includes enhanced tooltips to display territory violations, such as attribute and distance constraints.

And just like in suitability analysis, you can now easily undo, or redo manual territory edits or entire solve operations.
Enhancements to the Results pane
The Results pane is a crucial component of many workflows in ArcGIS Business Analyst Pro, interactively displaying analysis results through data summaries, visualizations, and a table. With this release, the Results pane is updated to support interactive selections and descriptive statistics. When running the benchmark comparisons workflow, summary, histogram, and scatterplot views are added to the Results pane.

Data browser improvements
The next time you open the data browser, you’ll notice a few key enhancements to viewing and selecting data variables. Visualization has been upgraded with the addition of a new node that conveniently lists all variables within a dataset. Managing and reordering variables has also been simplified. When creating a list, you can easily move selected variables using the arrow buttons or simply drag and drop them into your desired order.

A final exciting addition is the improvement of semantic search when working with numeric concepts. For example, when you run a search for a less defined numeric concept such as, ”young people” or, ”high-income”. When the find related variables, suggestion is turned on, semantic search has been improved to yield more intelligent results, filtering by most relevant.

Updates to working with segmentation data
There are additional exciting new updates to working with segmentation data such as Tapestry Segmentation data in the U.S. and PRIZM data in Canada. When running the color-coded layer workflow, the workflow will apply pre-defined cartographic styles to segmentation data. Want to learn more about the segmentation data you are working with? The metadata info button provides additional information such as name, vintage, and links to documentation.

Additional resources
We’re so happy to share this latest release of ArcGIS Business Analyst Pro with you and we can’t wait to see how you use these updates and enhancements to make smarter, data-driven decisions. Below, we’ve added resources to help you with your ArcGIS Business Analyst journey:
- Business Analyst product overview page
- Review pricing and purchase Business Analyst
- Join our LinkedIn Business Analyst User Group
- Join our Business Analyst Esri Community
- Follow our weekly #BATipsandTricks posts on social media
- Read more Business Analyst blog articles on ArcGIS Blog
- Watch Business Analyst Web App videos
- Watch Business Analyst Mobile App videos
- Visit the Business Analyst Resources page
- Visit the Community Analyst Resources page

Article Discussion: