The Emergency Response Guide (ERG) web tool enables users to visualize and analyze hazardous material spills directly within ArcGIS Online and ArcGIS Enterprise. The tool supports emergency planning and response by following distance guidance from the 2024 Emergency Response Guidebook’s orange and green pages, including:
- Table I: Initial Isolation and Protective Distances
- Table III: Large Spills of Toxic Inhalation Hazard Gases
- Boiling Liquid Expanding Vapor Explosion (BLEVE) scenarios
The Emergency Response Guidebook is a trusted reference used by first responders and emergency managers to assess hazardous materials and determine protective actions in the initial phase of an incident involving dangerous goods.
The ERG web tool can be accessed from Map Viewer or through the Analysis widget in ArcGIS Experience Builder, making it easily deployable across modern ArcGIS platforms. This tool delivers the functionality previously provided by the Emergency Response Guide widget in ArcGIS Web AppBuilder. As ArcGIS Web AppBuilder is scheduled for retirement in ArcGIS Enterprise in 2025 and ArcGIS Online in 2026, organizations are encouraged to begin migrating to this new tool.
Visualizing and analyzing hazard zones in real time
The ERG web tool supports both pre-incident planning and active emergency response by enabling rapid visualization of hazard zones based on current conditions. Responders can input parameters such as spill location, material type, wind direction, and time of day to generate threat zones that reflect evolving situations. In addition to visualizing these zones, the tool can be integrated with other spatial datasets to support a more informed and coordinated response. Outputs can be overlaid with infrastructure, demographic, or facility data to identify impacted populations and critical assets. This capability enables agencies to determine protective actions (evacuations or sheltering in place), generate alerts, or reroute resources with greater precision. The ERG web tool’s ability to feed into broader ArcGIS workflows makes it a flexible and valuable asset for first responders and emergency response.
The following figures show example outputs from the ERG web tool based on different spill scenarios and parameters.
Figure 1. Output zones generated are initial isolation (yellow circle), protective (yellow square), downwind (yellow cone), and fire isolation zones (red circle with white lines).

Figure 2. Output zones generated are initial isolation (yellow circle), protective (yellow square), and downwind (yellow cone). A fire isolation zone is not shown because it is not enabled.

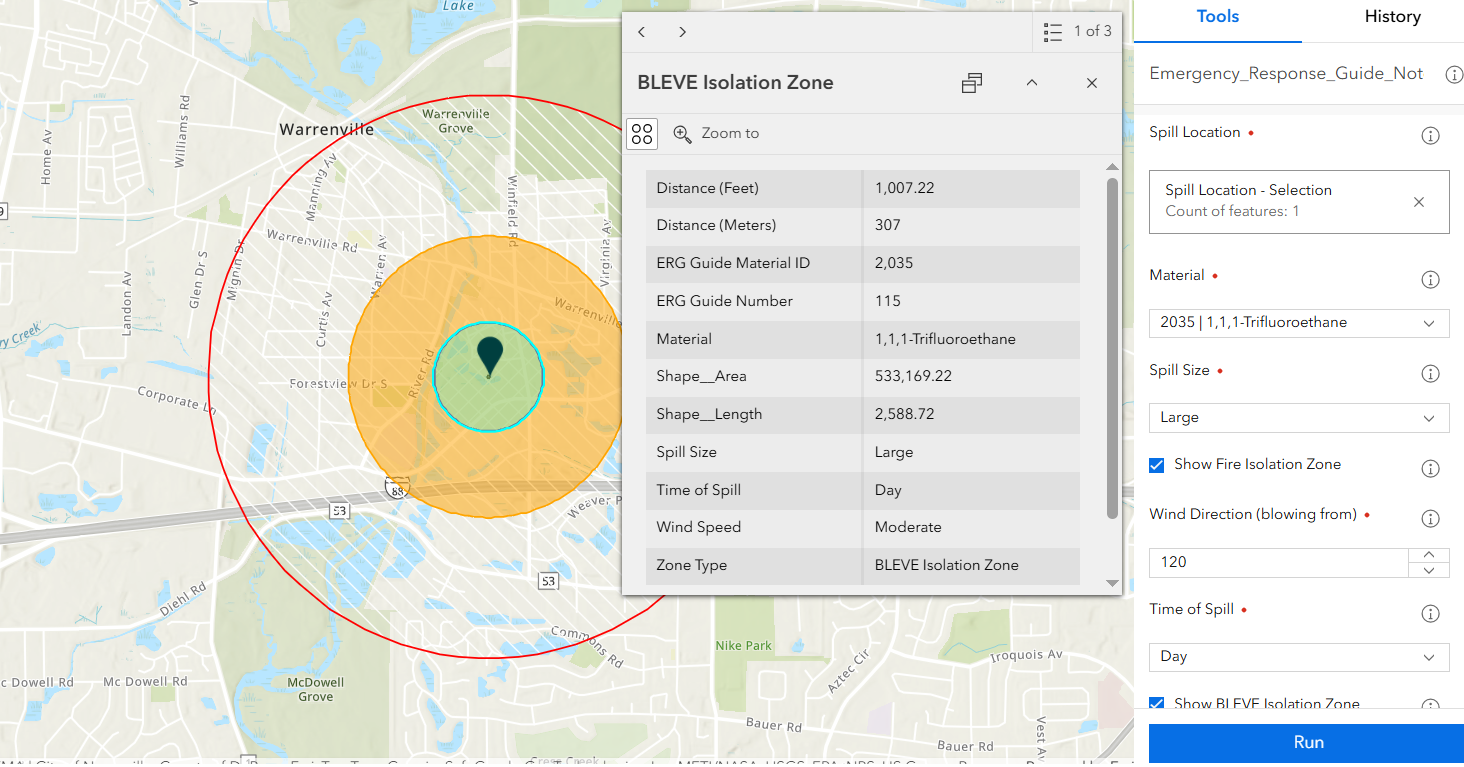
Figure 3. Output zones generated include a BLEVE isolation zone (innermost circle, highlighted in cyan and showing a pop-up), initial isolation (yellow circle), and fire isolation zone (red circle with white lines), for a scenario where BLEVE conditions apply.
Set up the ERG web tool
Step-by-step instructions for setting up the ERG web tool in your ArcGIS Online organization or ArcGIS Enterprise portal can be found in this Esri Community document. This document includes guidance on preparing an ArcGIS Notebooks notebook, configuring required data layers, publishing the tool, and integrating it into the Experience Builder Analysis widget.
With Web AppBuilder retiring soon, now is the time to transition to this next-generation tool.


Article Discussion: