ArcGIS Business Analyst Enterprise allows users to share spatial and business analytics, publish demographic and customer insight Infographics, apply location intelligence to decision-making, and develop repeatable workflows that link common tasks together. With Business Analyst Enterprise, users can enhance their on-premises infrastructure using Esri’s latest location-based analysis tools.
With the latest ArcGIS Business Analyst Enterprise release on May 22, 2025, we have delivered several highly anticipated updates. Business Analyst Enterprise includes multiple software components, and this release includes updates to the following:
- ArcGIS GeoEnrichment Server
- ArcGIS Business Analyst Web App
- ArcGIS Business Analyst Mobile App
- Business Analyst widget in ArcGIS Experience Builder
- ArcGIS Business Analyst Pro
Look out for the U.S. 2025 data update coming soon for Business Analyst Pro and Business Analyst Enterprise. The online data will be released June 25, 2025, and the local data is planned to be released one week later.
Now without further ado, let’s explore what’s new in Business Analyst Enterprise.
ArcGIS GeoEnrichment Server updates

ArcGIS GeoEnrichment Server is a server engine for Esri’s industry-leading demographic data. Using GeoEnrichment Server, users can find location facts and demographic characteristics for locations around the world.
ArcGIS GeoEnrichment Server has been updated with bug fixes and quality enhancements, such as improvements to disk space management during data installation.
ArcGIS Business Analyst Web App updates

The Business Analyst Enterprise 11.5 release includes updates to Business Analyst Web App that align with the November 2024 and February 2025 online releases There are several improvements, including the new benchmark comparisons workflow, enhancements to points of interest (POI) search, new geography comparisons, and more.
New benchmark comparisons workflow
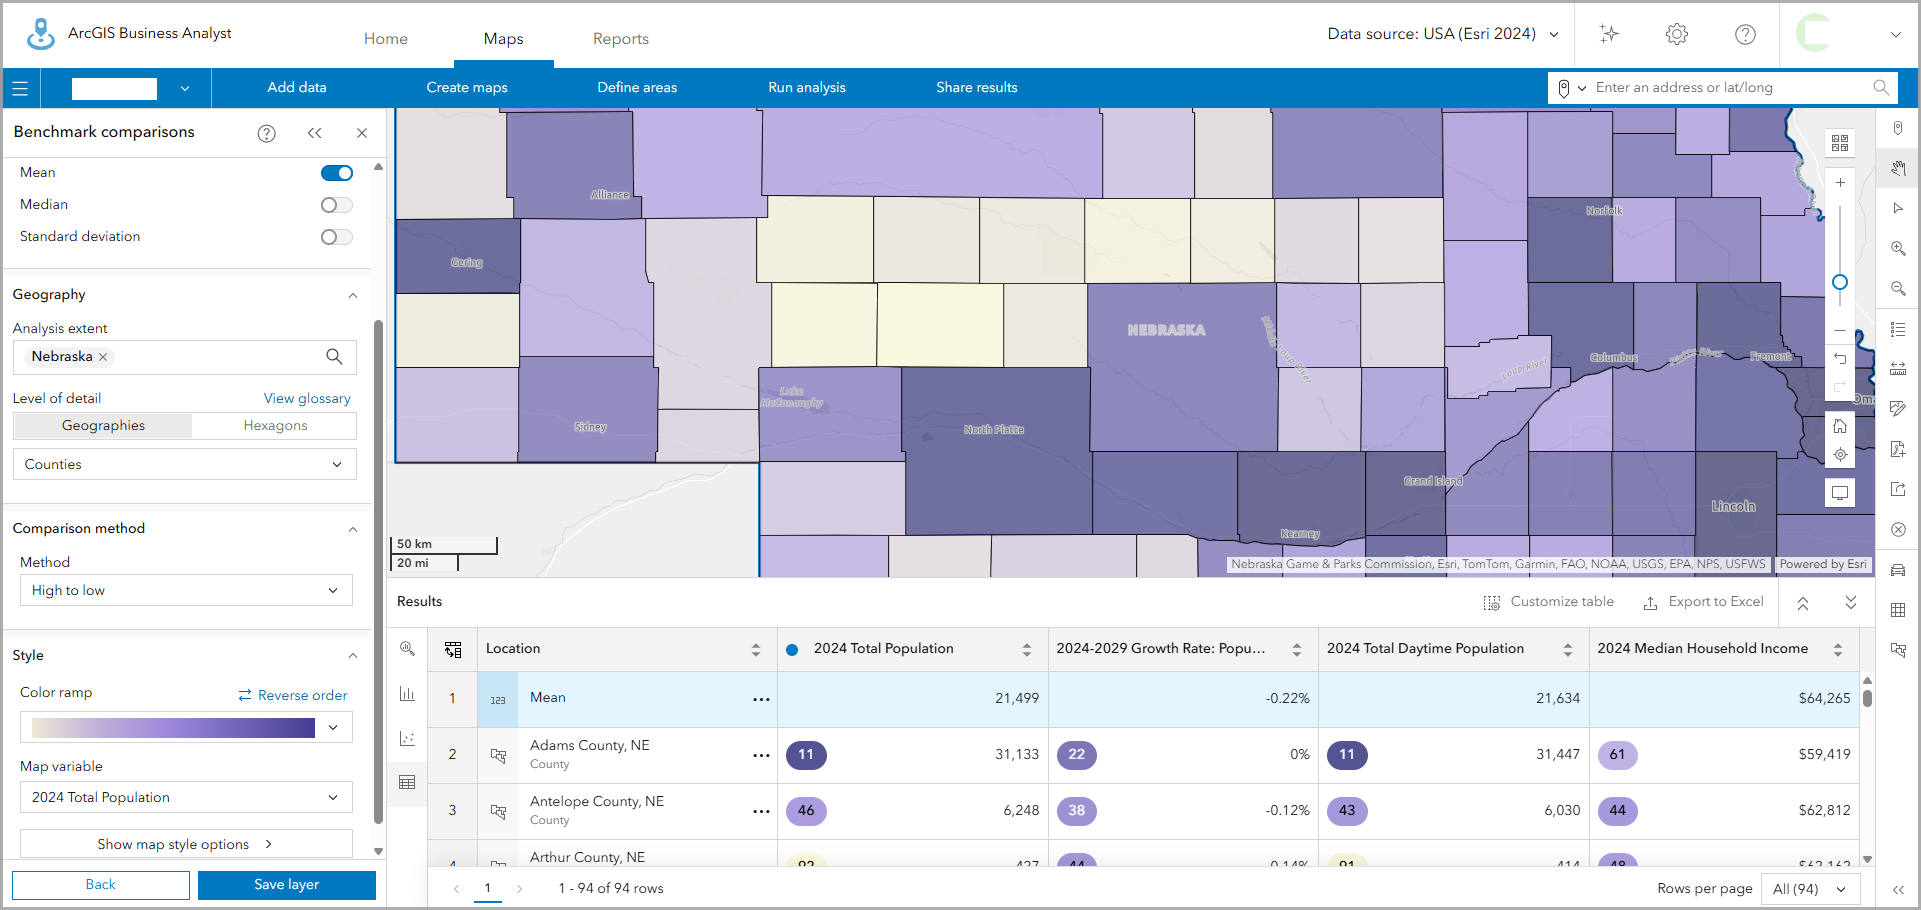
Remember comparison reports? They have been completely reimagined in the new benchmark comparisons workflow. Benchmark comparisons include mapping capabilities, enhanced map style options using indicator methods, new ways to view and summarize data, and in-app documentation to understand the underlying calculations.

Enhancements to points of interest (POI) search
Explore enhancements to the points of interest (POI) search workflow, including redesigned search options to improve discoverability. Add an advanced search condition to prefilter your results and provide more specificity to the search query, showing only results that match at least one of the criteria. Use the new Place map style that provides default sets of POI icons for datasets, enabling one-click intuitive symbology.
Familiar with the Results pane in workflows like color-coded maps and suitability analysis? Now points of interest (POI) search has its own Results pane, featuring a summary, histogram, bubble chart or scatterplot, and downloadable table.

Use the improved Geography section
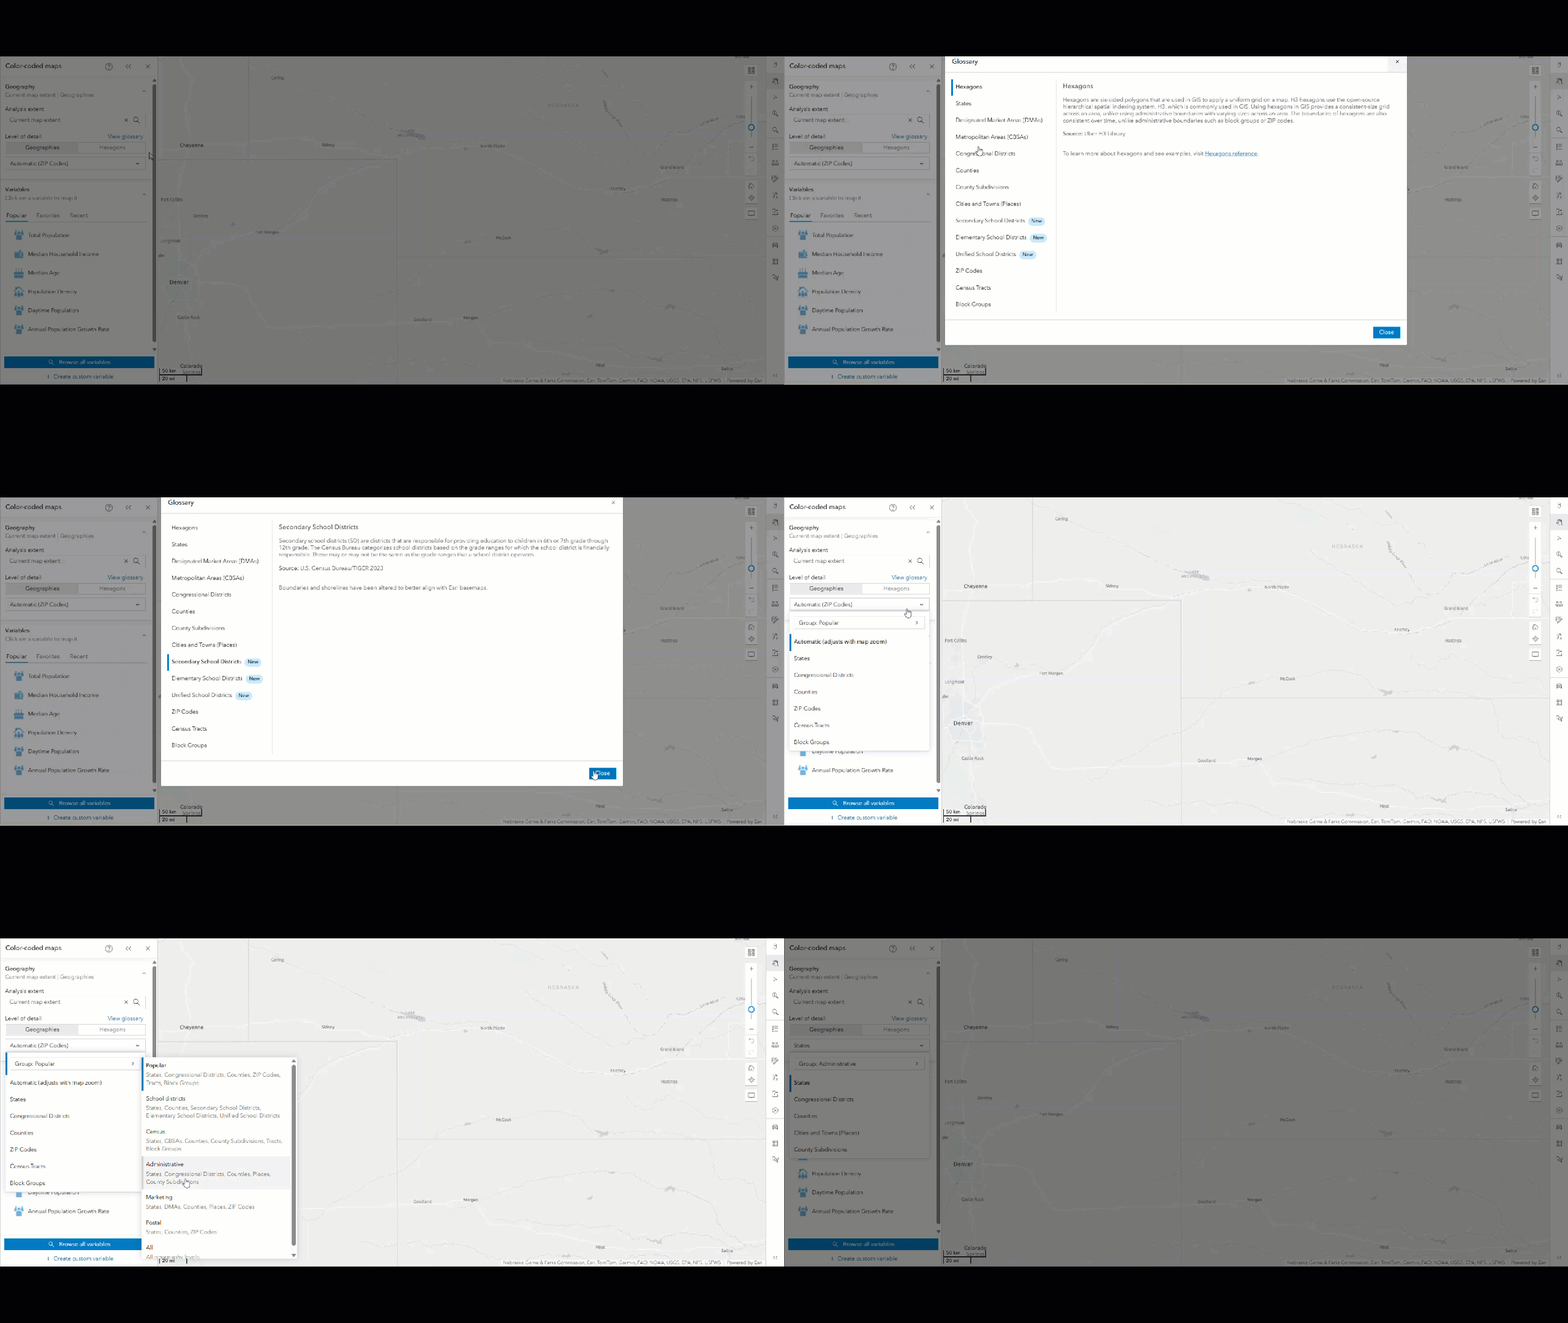
The workflow pane’s Geography section has been improved in color-coded maps, smart map search, suitability analysis, and benchmark comparisons. Depending on the data source you’re using, click the Group menu and select a list of grouped geographies (such as census geographies or school district geographies) and choose a geography level to map. You can also view an in-app glossary to read definitions for each geographic level if you’re using U.S. data sources.

New geography comparison
Analyze your sites in the new geography comparison table, available in a site’s pop-up menu and in the benchmark comparisons results pane table. Enhancements to geography comparison include customizing the table and setting preferences for default variables.
Infographic improvements
Infographics in Business Analyst have a number of key improvements, including many accessibility improvements, support for SVG logos, and improved logo customization.
Business Analyst Mobile App enhancements
Want to use ArcGIS Business Analyst on the go? No problem! Simply download ArcGIS Business Analyst Mobile App from the App Store or Google Play. You can run infographics, edit site attributes with panoramic photos, and view maps.
ArcGIS Experience Builder: Business Analyst widget
The Business Analyst widget in ArcGIS Experience Builder is a popular tool that provides users with the ability to view additional information about any point or polygon feature on a map through the creation of reports and infographics.
The Business Analyst widget in Experience Builder has been updated with bug fixes and performance improvements.
ArcGIS Business Analyst Pro

The latest release for Business Analyst Pro was on May 13, 2025. Improvements in Business Analyst Pro include improvements to several popular workflows such as color-coded layers, benchmark comparisons, suitability analysis, and territory design.
There are even more updates to explore in Business Analyst Pro, so view the following blog article for details on new features, tools, and enhancements: What’s new in ArcGIS Business Analyst Pro | May 2025.
Additional resources
We hope you enjoyed seeing what’s new in this latest update of ArcGIS Business Analyst Enterprise! Below you can find additional links that you may find useful.
- Business Analyst product overview page
- Review pricing and purchase Business Analyst
- Join our LinkedIn Business Analyst User Group
- Join our Business Analyst Esri Community
- Follow our weekly #BATipsandTricks posts on social media
- Read more Business Analyst blog articles on ArcGIS Blog
- Watch Business Analyst Web App videos
- Watch Business Analyst Mobile App videos
- Watch Business Analyst Pro videos
- Visit the Business Analyst Resources page


Article Discussion: