An important part of infrastructure operation is understanding how to respond when critical assets fail. A branch falling on a power line can take out power for a few houses, but a water main break can cause structural damage and the loss of service to a neighborhood. Each of these situations require specialized tools to isolate the failure and develop a response plan.
Customers who are familiar with the capabilities of the utility network know they can use their GIS to answer these kinds of questions. The utility network includes various trace types designed to answer different questions using your network, two of the most common traces are the upstream and downstream traces:
- Upstream traces allow you to understand what features deliver water or electricity to the current location.
- Downstream traces allow you to understand areas impacted by events at your current location
The Isolation trace type allows you to simultaneously answer both these questions. What devices upstream of a location can I operate to isolate the area, and what downstream impact this will have on customers and equipment in the affected area.
This article will outline some of the best practices for configuring isolation traces to address different scenarios. Once an isolation trace has been configured for a utility network in the form of a named trace configuration, analysis can be performed in any desktop, web, or mobile application that supports utility network tracing
Isolation Trace
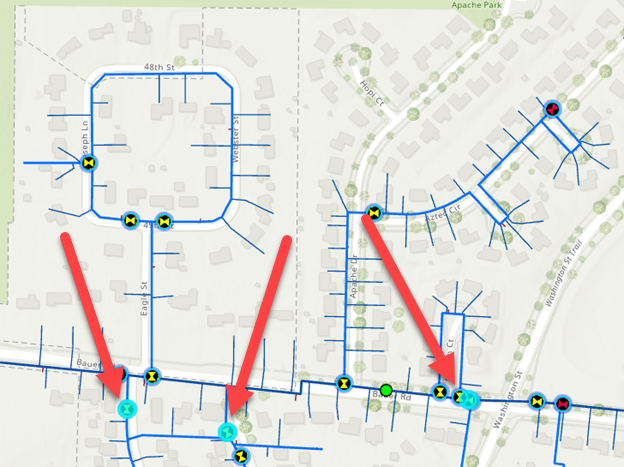
If your utility network already has an isolation trace configured, running an isolation trace is as simple as opening the Trace pane, setting a start location, and running the trace from the Named Configuration tab. The answer to your isolation question will then be displayed on the map, as shown in the screenshot below:

If you don’t already have an isolation trace configured, or you want to change the behavior of your existing isolation trace to answer a slightly different question, then you can use the Trace geoprocessing tool to configure and run an ad-hoc trace.
When configuring an isolation trace you must identify the domain and tier to be considered for analysis. This is because an isolation trace needs to know which sources/sinks to consider when identifying the extent of the isolation area. Are you interrupting service to a water pressure zone? An electrical circuit? A gas distribution system? Each of these tiers has a different set of equipment and trace configurations associated with it, and selecting the correct tier ensures the trace produces an accurate result.
In this example we will be running an isolation trace on a water network, choosing to isolate based on the Water pressure source(s) of this system. This was chosen instead of the Water System tier for several reasons. Using the Water System (which represents all water sources) requires analyzing more features and doesn’t consider how sufficiently water storage devices such as storage tanks, standpipes, water towers provide water specific areas in the network. If you wish to understand impacts on an area of the network that will be without water for an extended period, you may want to use the Water System tier instead or consider using a hydraulic model to analyze operational impacts on the water system over time.

By selecting the Water Pressure tier the Trace tool will automatically be populated with the condition barriers configured for that tier’s subnetwork definition. In this case the Water Pressure tier is configured to stop at closed valves, features that aren’t active in the network, and equipment used exclusively for cathodic protection.

Once you’ve identified how the isolation trace will discover its sources, you must then determine how the system will identify the equipment used to isolate the area. This is done by configuring filter barriers.
Filter Barriers
Trace configurations have several types of barriers that can be configured. A condition barrier is used to control traversability in the network. In the context of an isolation trace, this means it controls how the trace finds a path to sources/sinks as well as determine which features are served by those sources/sinks.
Therefore, to perform an isolation trace a second kind of barrier is needed that allows you to identify the features used to isolate portions of the network. This is where the filter barrier comes in. A filter barrier allows you to define a separate set of criteria that will identify candidate features to isolate an area of the network.

First, the trace ensures that the area being analyzed has one or more valid controllers, then it will use the filter barrier to identify features between the starting location(s) and the source(s). These are the features that can be used to isolate the area.
By default, the isolation trace will only return the features that isolate the area. If you want to also include the affected features in the result, you must select the Include Isolated Features option.

Once you’ve configured your initial trace configuration you should consider saving it in the database as a Named Trace Configuration. This will allow you to easily perform the same trace using the Trace geoprocessing tool, the Named Configurations tab on the Trace pane, or in any web or mobile application that supports tracing utility networks.
As you begin using the isolation trace you may find that there are additional adjustments you want to make to the trace to answer more specific questions or handle unique scenarios. Many of these questions can be answered by altering the filter barriers:
- Only consider features designed to be operated under load: (Load Break = True)
- Only consider features that are accessible and operable: (Accessible = True and Operable = True)
- Only consider features maintained or operated by your organization: (Owned By = Our Agency)
The next few sections will show you some additional parameters in the trace configuration you can use to control the results of the trace.
Output
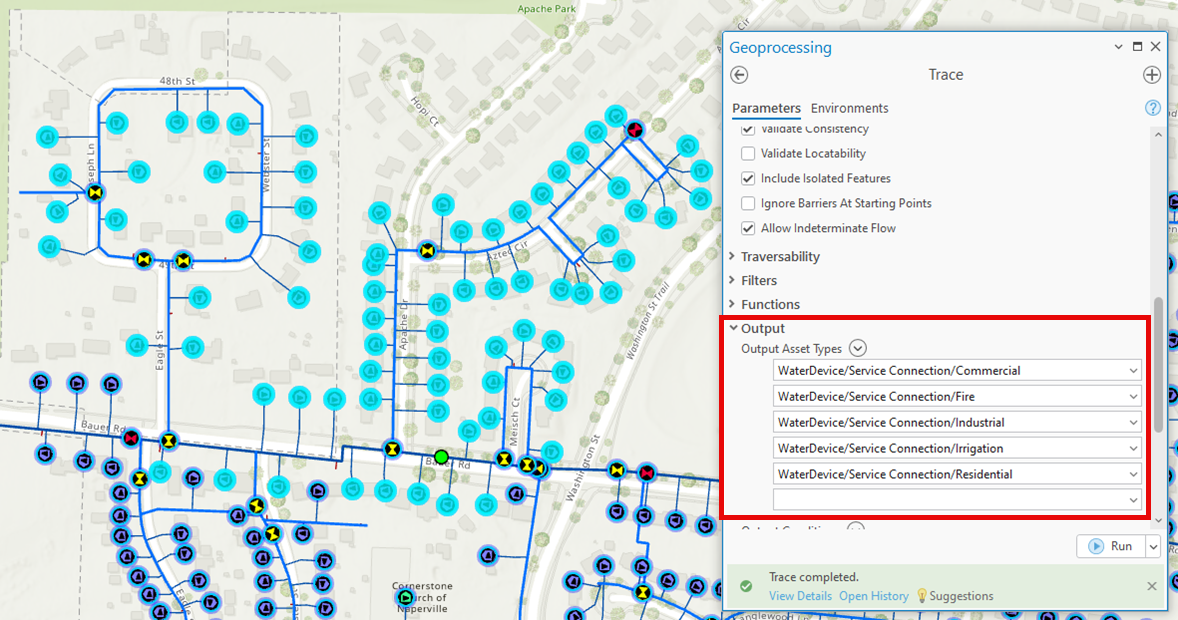
In a situation where a large area is isolated you often want to know if certain types of equipment are affected. These may be large commercial or industrial customers, sites that are sensitive to service interruptions such as hospitals, or other types of critical infrastructure. The good news is that if this information is available in the network data, the trace results can be configured to draw attention to these important areas. The primary way of doing this is by controlling which features are output by the tool.
The easiest way to limit the output is by using the asset types of the features involved. This allows you to only include certain types of features in the results, regardless of their other attributes or configurations. The trace below returns only customer services by enabling Include Isolated Features and setting the Output Asset Types to the different types of service connections.
Output can also be controlled using network attributes or network categories. This allows you to configure an output condition, like a condition barrier or filter barrier, to determine which features to output using network attributes or network categories. In the example below the output is filtered to return closed valves. These are valves that could be used to provide alternative water sources in an emergency.

The example below uses a network attribute to identify equipment owned or operated by another organization. This is an important consideration when looking at equipment used to isolate an area, as you may need to coordinate the outage or interruption with another organization. In the example below you can see a small portion of the neighborhood has infrastructure that is privately owned, so you will need to coordinate the outage closely with the property owners.

In addition to controlling what features are returned in the trace, it’s often desirable to perform some calculations about the affected area. While this could be done by limiting the results and performing calculations manually, the trace can also be configured to perform some basic calculations.
Functions
When running the isolation trace it’s possible to perform some basic calculations using the Functions parameter of Trace tool. Even though the calculations are simple, they provide more detail about the results without needing to review attributes on any features. The calculations are performed across all the resulting features, using any network attributes and a basic mathematical operator. Examples of calculations include the following:
- Count – How many customers are affected?
- Add – What is the total length of pipe or wire affected?
- Min – What is the smallest diameter pipe in the affected area?
- Max – What is the largest demand or load that is impacted?

While it’s not possible to do more granular reporting using the trace dialog directly, it is possible to use the selection from the trace to populate a chart in either ArcGIS Pro, ArcGIS Experience Builder, or ArcGIS Dashboard.
Using this technique, you can create more interesting visualizations like the examples below:

Aggregated Geometry
In this article you have seen how to visualize the results of the trace through map selections, summary statistics, and charts. These methods work well for most situations, but a common issue with visualizing using the map and selection sets is that lines aren’t always split at the location where the system is isolated. In these cases, the entire line (like a large distribution main) will be selected, even though the trace really stops at a system valve in the middle of the pipe. This gives the impression that the extent of the outage is much larger than it is, as you can see below.

In the above graphic a single customer is affected, but because the valves being operated are on a large distribution main that hasn’t been split it appears as if a larger area is affected. This happens because ArcGIS Pro is selecting the entire feature and doesn’t have a way to select individual segments within the feature. The way to handle this with trace is to use the Aggregated Geometry result type to populate a layer with the geometries of just the features that were affected.

When selecting this option, you can choose to update an existing layer with the results and can even choose to append the results with a unique name so multiple results can be compared. It is important to use the aggregated geometry result type when using a function barrier on length field to stop after a certain distance. This ensure that the trace result only shows the partial length of the edge that satisfies the function barrier. Learn more about this by reading the function barriers topic in ArcGIS Help.
Conclusion
If you’re interested to learn more about tracing and analysis with ArcGIS Utility Network you should visit the Analysis and Tracing with ArcGIS Utility Network learning series. This series contains a collection of articles, videos, and tutorials to help familiarize you with tracing, subnetworks, and ArcGIS Utility Network.
Read the Configure a trace page in the ArcGIS Help for a comprehensive discussion of all the parameters available when configuring a trace.
If you have specific questions about how to solve different workflows, please visit us on the ArcGIS Utility Network channel on the Esri Community site. This is an active community with thousands of active members.


Commenting is not enabled for this article.